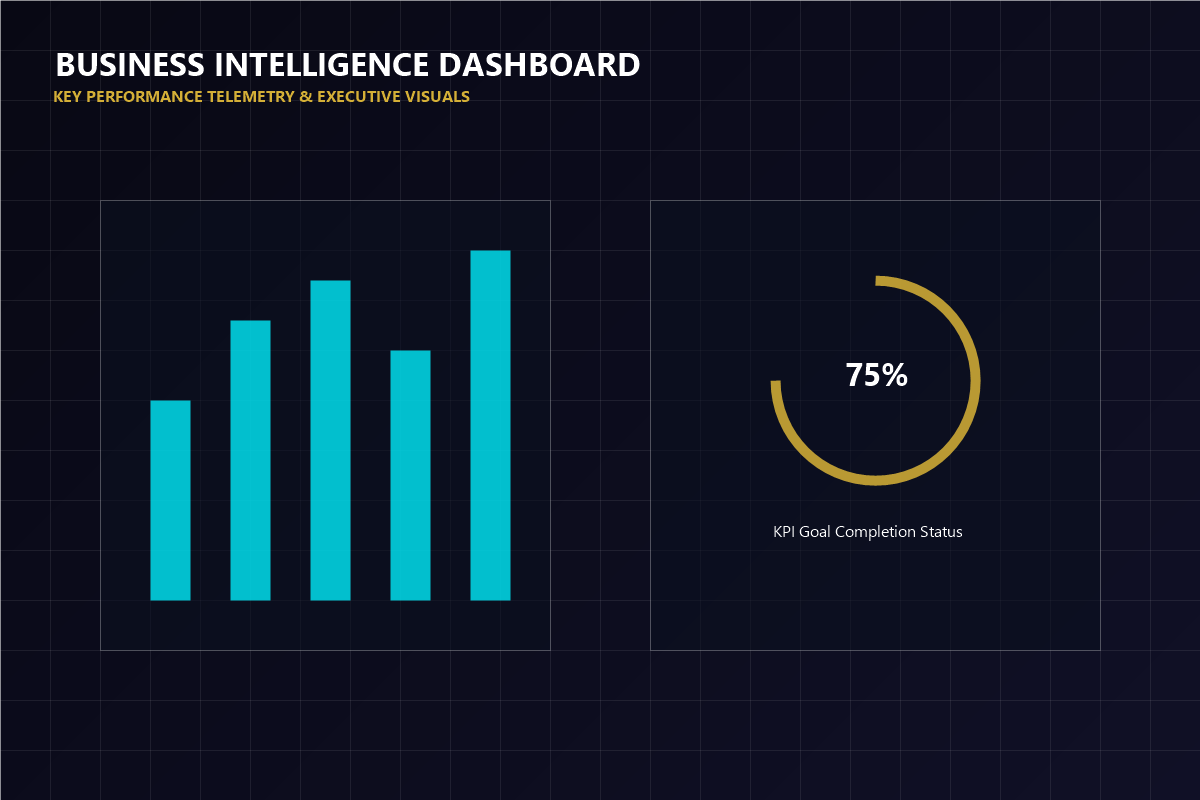
Make complex data easy to understand at a glance. We construct dynamic interactive dashboards and automated metrics aggregators to track corporate KPIs, resource allocations, inventory status, and grid loads in real-time.
Instead of loading heavy database tables that delay execution, our lightweight visualizers use secure client-side caching and pre-compiled views. This cuts database query cycles, preserving server resources and lowering compute loads. Our dashboards connect directly to secure live APIs, presenting real-time progress indicators while keeping critical data locked behind roles.
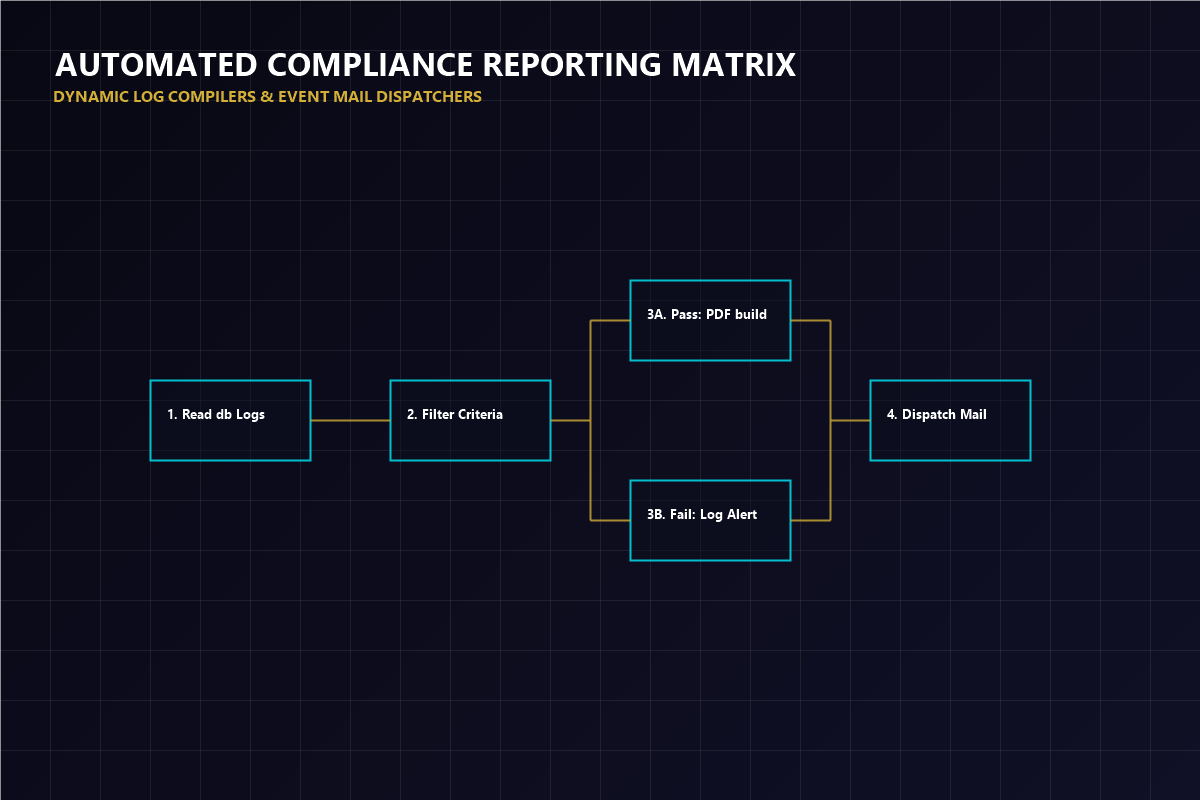
Orchestrating executive reporting requires structured telemetry sync and secure audit formatting.
Connecting data hooks to ERP and database streams, pulling raw updates into local visual cache blocks.
Filtering raw inputs based on custom performance targets, isolating trend metrics from temporary database fluctuations.
Compiling weekly and monthly progress into encrypted PDF dossiers, checking format compliance rules automatically.
Routing compiled reporting folders to specific user roles, ensuring private indicators remain hidden from unauthorized view.
We compile live database parameters into clean dashboards with built-in role locks.
Dashboards scale perfectly from desktop monitors down to mobile screens for convenient on-the-go reviews.
Streaming queries update visual chart nodes instantly as database records are modified.
Applying security locks to restrict specific dashboards, ensuring that private metrics are hidden from standard views.
Aggregating multi-source performance indicators into unified target tracking rows for simple board reviews.
Compiling query parameters into encrypted PDF logs automatically, ready for distribution to stakeholders.
Adding visual trends and moving average lines to dashboards, highlighting operational patterns clearly.
Speak with our business intelligence architects to structure dynamic, secure metrics visualizers.
Request dashboard design